2025 Annual Community Survey
2025 Annual Community Survey
South Jordan City
Council Study Meeting
February 17, 2026
Key Survey Findings
2025 Community Survey
City Direction and Quality of Life
- Majority Positive Outlook: 60% of respondents believe South Jordan is heading in the right direction, with only 10% saying it is going the wrong way. However, uncertainty has increased slightly (31% unsure, up from 26% last year).
- High Quality of Life: The average quality-of-life rating is 82 out of 100, with 90% rating it 70 or higher. This high rating is consistent across all city districts.
Leadership and City Services
- Leadership Approval: 52% of residents approve of city officials, with District 4 showing the highest approval. Disapproval remains low.
- Service Satisfaction: 72% believe city services provide good value for their tax dollars. Fire/emergency services, garbage collection, and city parks all received satisfaction ratings of 80 or above.
Community Satisfaction and Recommendations
- Strong Community Endorsement: 91% would recommend South Jordan as a good place to live, with 60% 'very likely' to recommend it.
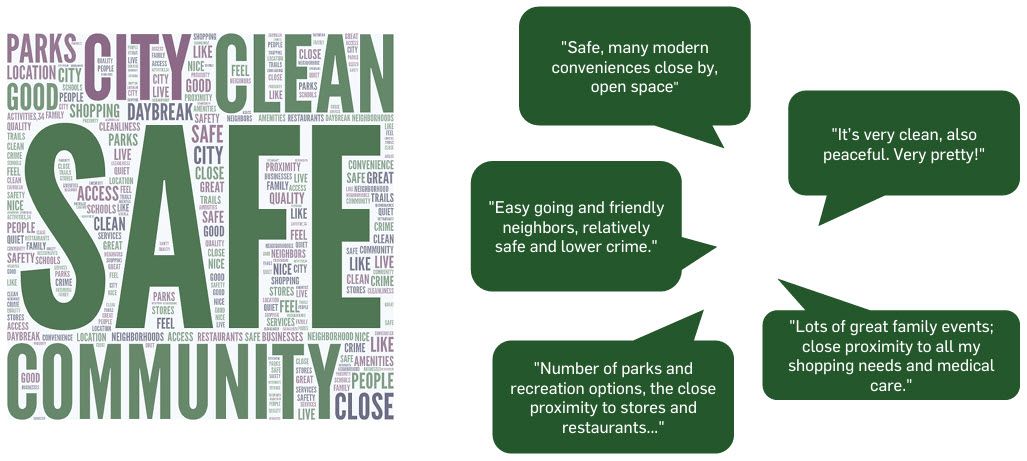
- What Residents Like: Safety, cleanliness, community feel, and convenience to essentials are most valued.
Growth, Traffic, and Future Concerns
- Top Issues: Growth and resulting traffic are the most important and prevalent concerns, both now and for the next five years. Residents also worry about housing affordability and maintaining safety.
- Urban Center Development: Awareness of the Downtown Daybreak urban center project has increased. While 83% see positive economic impacts, 82% are concerned about negative traffic impacts.
City Priorities and Performance
- Priority Ratings: Recreation, city events, and safety are rated highly. However, ratings for transportation and long-term growth have declined (down 7 and 4 points, respectively, from last year).
- Performance Trends: Overall, performance ratings for city priorities have declined since 2024, especially in recreation, safety, and communication.
Communication and Engagement
- Preferred Communication: City emails are the most used and preferred source of information. 71% are satisfied with monthly emails, and 94% find city communications at least somewhat useful.
- Contact with City: The rate of residents contacting the city dropped to a new low of 31%. Most issues are resolved within one or two contacts, and 83% of those who contact the city feel they are treated with courtesy and professionalism.
Online Services and Social Media
- Website Usage: Paying and connecting utilities are the most common online tasks, with high satisfaction ratings for these services.
- Social Media: Over 60% do not follow the city's social media accounts, but those who do find them useful, especially on Facebook.
Demographics and Methodology
- Survey Reach: 1,035 completed responses from an estimated 80,000 adults (14% response rate, margin of error ±3%). Responses were weighted for demographic accuracy.
- Representation: All five city council districts were well represented.
Summary Table of Key Metrics:
Metric 2025 Value
Right Direction 60%
Quality of Life (avg/100) 82%
Leadership Approval 52%
Recommend City 91%
Service Value (Good+) 72%
Contacted City (past year) 31%
Top Concern
Growth/Traffic
Urban Center Econ. Positive 83%
Urban Center Traffic Negative 82%
These findings provide a clear snapshot of resident sentiment, strengths, and areas for improvement in South Jordan as of 2025.
Reference:
https://sjc.utah.gov/DocumentCenter/View/7661/South-Jordan-2025-Community-Survey-Report
Key Council Meeting Topics
E.1. Y2 Analytics – Community Survey Results
Survey Overview and Methodology
- The annual resident survey was conducted by Y2 Analytics from January 5–19, 2026, with 1,112 responses and 807 completions, yielding a robust sample (margin of error ±3.4%).
- The survey included both returning panelists and newly sampled households, with responses weighted for demographic accuracy.
Resident Satisfaction and City Direction
- High satisfaction: an average quality-of-life rating of 81/100, consistent across districts.
- 57% believe the city is headed in the right direction; 15% think it is headed in the wrong direction; 27% are unsure (uncertainty has decreased from last year).
- Approval ratings for the City Council increased by 10 points from the previous year, with 62% of residents approving of city officials.
- 89% of respondents would recommend South Jordan as a good place to live.
Key Concerns and Priorities
- Growth and traffic remain the top concerns for residents, both currently and over the next 3–5 years. Infrastructure and housing are also recurring themes.
- Traffic flow is the highest priority for residents (28%), followed by quality of life and safety.
- Residents are generally satisfied with city services (average rating: 73/100), but code enforcement and planning/zoning/building services received the lowest ratings, reflecting frustration with growth management.
City Services and Communication
- Fire/emergency medical services and garbage collection received the highest satisfaction scores (86/100).
- Police services are highly rated (80/100), with council members noting strong resident appreciation for public safety.
- Residents prefer to receive city information via email or digital newsletters, with a majority satisfied with monthly communications.
- Most residents use the city website for utility payments and service requests, with high satisfaction for these online tasks.
Resident Engagement and Feedback
- 31% of residents contacted the city in the past year, primarily for public works and code enforcement; police-related contacts have decreased.
- Most issues are resolved on first contact, and residents report being treated with courtesy and professionalism (80% agreement).
- Survey fatigue was noted, with suggestions to split the survey in future years to maintain data quality and reduce respondent burden.
Urban Center Development Awareness
- Awareness of the Downtown Daybreak Urban Center development has increased, but 17% of residents remain unaware.
- Residents see positive impacts on economic development, quality of life, and public transit, but express concerns about increased traffic, crime, and parking.
Council and Staff Reactions
- Council members and staff discussed the importance of addressing growth, traffic, and communication preferences.
- There was recognition of the need to adjust survey methodology to reduce fatigue and improve engagement.
- Departments receive and review verbatim survey responses to address specific service issues and improve responsiveness.
Example Implementation:
- The council can use these findings to prioritize traffic and growth management in strategic planning.
- Consider splitting future surveys to reduce fatigue and maintain high response rates.
- Continue to enhance digital communication channels, focusing on email and website improvements.
- Monitor and address lower-rated service areas, especially code enforcement and planning/zoning, to improve resident satisfaction.
This summary provides a clear, actionable overview of the council's discussion and the main takeaways from the Y2 Analytics Community Survey Results as presented in the meeting.
Reference: